Actually, that’s a dirty lie.
Profiling is fun when it shows you something big that’s easy to fix. Profiling is a lot less fun when everything is equally slow. But luckily in my case, there was something big to fix. :)
I noticed the other day that editing roads in MMORPG Tycoon 2 had become extremely slow. (Well.. actually I noticed that roads didn’t draw at all. It was only after I fixed them not drawing that I noticed that they were slow to edit). This was odd, because I have videos of early road editing, where it hardly touched the frame rate at all on a system much slower than the one I’m using now. So after some profiling, I found that creating their procedural geometry was taking up about 75% of the whole processing time for the frame when they were created. This was extremely bad when editing them, especially (because they’re regenerated every frame, when they’re being edited, or when the ground under them is being edited).
Those of you who were at Freeplay will remember the part of my talk where I discussed optimising games, and when to do it (or rather, when not to do it).
For those who weren’t there, the tl;dr version is this: don’t optimise anything unless you have timing numbers that proves it’s slow relative to the rest of your program, and against which you’ll be able to judge your progress. Ideally, you get these numbers by using a profiler of some sort. (Visual Studio has one built in, modern Xcode uses Instruments while old Xcode used Shark, under Linux you have gperf, etc)
What I didn’t say in that talk (and which I’ve regretted ever since), is that there’s a second criteria which can make it acceptable to optimise some code, even if you don’t have performance numbers. Here is that other criteria:
Monte Carlo Profiling
- Make a build of your game with optimisations turned on (a “release” build, or “retail” build, or “dist” build, or whatever you call it), but with debugging symbols still present.
- Run this build through your debugger of choice.
- At any time of your own choosing, pause the execution of the game, and examine the call stack shown in your debugger.
- Repeat step 3 nine more times (for a total of ten pauses and ten callstacks).
- If in seven of the ten total times you paused the game you were in the same area of code, then you may spend time optimising that area of code, even without first profiling it.
The Monte Carlo test is basically very quick and ad hoc profiling. Profiling does exactly this same process, but instead of doing it ten times, it does it millions of times, far faster than you’re able to do it manually. It avoids having to go to the bother of setting up proper profiling, and will still point out anything that’s extremely slow in your code.
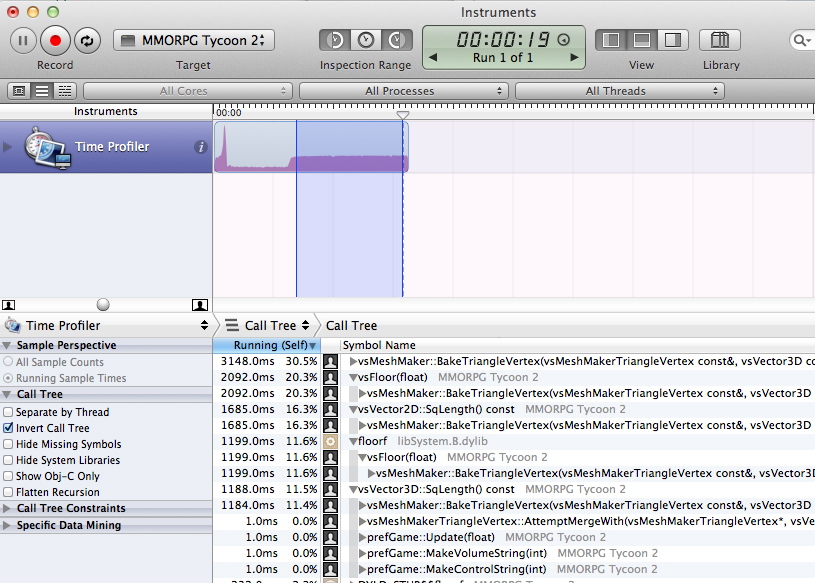
But back to my story. In my case, I did do real profiling. Here’s what it looked like in Instruments:

That graph is of CPU usage. (Also, it totally breaks the site frame layout, but I don’t care. I want you to see the details. :) ) The spike at the start is the game starting up (and generating all the world geometry all at once). The low part in the middle is just me looking around a bit, and then the heavy bit that I have highlighted is me editing a road — just dragging one of its endpoints around the map at random.
As you can see from the screenshot, it’s spending about 30% of the frame time in vsMeshMaker::BakeTriangleVertex, 20% of its time in vsFloor (called from vsMeshMaker::BakeTriangleVertex), 16% of the frame time in vsVector2D::SqLength() (also called from vsMeshMaker::BakeTriangleVertex)… you get the idea. Add it all up, and we were spending about 75% of our CPU time inside BakeTriangleVertex. That BakeTriangleVertex function was really, really heavy for some reason, and I needed to figure out why.
Basically what vsMeshMaker::BakeTriangleVertex does is to look at all the triangle vertices in a procedurally generated model, and to decide (one at a time) whether they should be merged with other nearby vertices to make a smoothly curving surface. The hardest part of this is actually finding other nearby vertices. Previously, I had sped this up by dividing up space into grid squares, and storing each vertex into the appropriate grid space. Then when I wanted to know about nearby vertices, I only had to check the other vertices in the same grid space, not every other vertices in the model.
But as it turns out, those grid spaces were too large, especially for large objects like roads, and so I was still comparing far too many vertices for merging. So I increased the number of grid spaces (and made each grid space smaller, so there would be fewer vertices to test in each), so that instead of having an 8x8x8 grid and needing to test every vertex in those large squares, we have a 32x32x32 grid and only need to test every vertex in much smaller squares. I had also noticed that very simple functions like vsFloor and vsVector3D::SqLength() were showing up in the profiling, and so made those functions inline, to hopefully reduce the cost of calling them. This led to this graph:
This one is fascinating. Notice that the amount of CPU being used has dropped substantially, compared to the previous one. Also note that functions like “vsFloor” and “vsVector3D::SqLength” have vanished, since I made them inline (they’re now included in the caller’s time). Increasing the resolution of my vertex lookup grid had sped things up a lot — we’re down from 75% of our frame time, down to an average of 40% of our frame time (and made a huge improvement to the frame rate). But here’s the interesting thing that I hadn’t noticed previously:
Look at that graph, how it increases over time. I wasn’t doing anything unusual in-game, just rapidly dragging one end of the road back and forth over a single area of terrain. But the more time I spent editing the road, the slower editing became. This eventually pointed me to a bug in my code, where some of the merging work from previous frames was being left-over to do again on all subsequent frames, even though it didn’t accomplish anything on the new frames. So I fixed that bug, and profiled again:
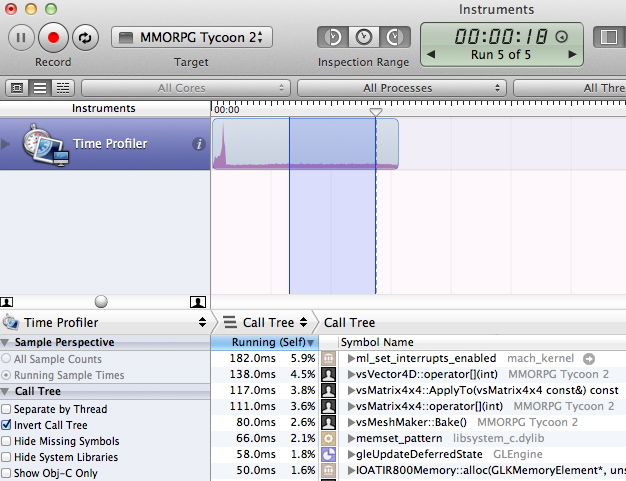
Great! Getting rid of that leftover repeated work brought us down from 40% frame time (on average, during a long editing session) to about 2.6% frame time, low enough that you don’t even notice a frame rate hit in-game.
The problem now was that my grid was so fine, that it actually uses a lot of memory. A 32x32x32 grid has about 32,000 spaces in it, and each of those needed storage to hold an arbitrary number of vertices. And I had one of these for every road (and indeed, every building, tree, etc). That builds up fast! And while 2.6% is low enough to be acceptable, I would have liked it to be even lower. Let’s face it, my placeholder “road” model is ridiculously simple. I’d really like this code to be much faster than it is now, to handle the much more detailed meshes that I’ll be throwing at it later.
So I set out to replace the grid with a new structure: an octree. For those who are interested, this implementation has been ported back into the main VectorStorm trunk, as VS_PointOctree.h, inside the VS/Utils/ directory. It’s basically a tree structure which expands as more data is added to it, so it should behave far more predictably than the grid structure. What’s more, it expands as data is added, instead of being a fixed (huge) size, which means that smaller models use much less space, exactly as you’d hope. Profiling isn’t much different (down to about 2%), but memory usage is drastically lower. So I call that a win. And in future, I may return to this code to see if I can’t whittle it down even a little further, once it starts moving up into a prime spot in the profiling again.
I’ve also been doing other stuff recently, but I reckon that this blog post is enough of a novel already, so I’ll save the other stuff for tomorrow.


